ChartGPT: Turn Text into Charts with AI — Free Online Tool
- Name
- Sebastian Brandt
Updated on
ChatGPT is one of the hottest names in the town, sitting on the crown of the large language model(LLM). For data analysts who need to create charts from data, it has long been a dream for using the magic wand of ChatGPT for automatic chart building.
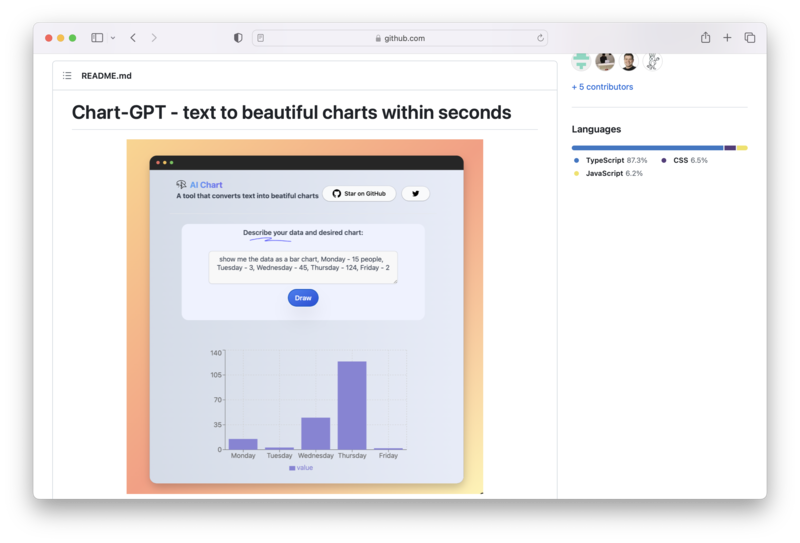
Enter ChartGPT, a powerful tool that converts text into beautiful charts within seconds. In this article, we'll explore ChartGPT, its features, and how to get started. We'll also compare it with RunCell, a notebook-first AI agent for code, analysis, and visualization workflows.
- Runcell Science: An Open Source Alternative to Claude Science for Research Workflows
- How to Make Mac Not Sleep: Keep Codex, Claude Code, and AI Agents Running
- OpenClaw vs ZeroClaw vs Pi Agent vs Nanobot: Which AI Agent Stack Should You Choose in 2026?
- Can Claude Code Analyze Jupyter Notebooks for Data Science? What It Actually Does
- Claude Code Routines: Why AI Agent Cron Jobs Matter
- Claude Code Desktop Bypass Permissions: How to Enable It
- How to Build Two Python Agents with Google’s A2A Protocol - Step by Step Tutorial
- Top 10 growing data visualization libraries in Python in 2025
What is ChartGPT?
ChartGPT is an open-source project designed to make the process of creating charts as easy as writing a simple text description. With a few lines of code, you can generate visually appealing and informative charts based on your data. Whether you're a seasoned data analyst or just starting, ChartGPT can help simplify your charting tasks.
Getting Started with ChartGPT
Setting up ChartGPT is a breeze. Follow the steps below to get started:
- Clone the ChartGPT repository:
git clone https://github.com/whoiskatrin/chart-gpt.git
cd chart-gpt- Duplicate the
.env.exampletemplate and add your OpenAI API key:
cp .env.example .env
OPENAI_API_KEY="your-api-key"- Install the dependencies and start the development server:
npm install
npm run dev

## or
yarn
yarn dev
Now you're ready to go! The development server will start at http://localhost:3000.
Contributing to ChartGPT
ChartGPT is an open-source project, and contributions are welcome. If you'd like to contribute, follow these steps:
- Fork the ChartGPT repository.
- Clone your forked repository.
- Make your changes, commit them, and push them to your forked repository.
- Create a pull request on the ChartGPT repository.
RunCell: A Notebook-First Alternative to ChartGPT
While ChartGPT is an excellent tool for creating charts from text, RunCell (opens in a new tab) is a stronger fit when the workflow goes beyond a one-shot chart. It runs inside Jupyter, so you can write code, analyze data, and iterate on visualizations without leaving the notebook.
RunCell is especially useful when you want charts plus real analysis. Instead of stopping at a generated figure, you can keep refining the code, inspect outputs, and continue the notebook flow.
Some of the features RunCell offers include:
- Jupyter-native code generation and execution
- Iterative chart refinement with notebook context
- Live work on DataFrames, CSVs, and Python plotting libraries
- A tighter workflow for analysis, debugging, and visualization
Want to try a notebook-first chart workflow? Start with RunCell (opens in a new tab).
Final Thoughts
RunCell (opens in a new tab) is a strong next step when you want chart generation plus notebook-native analysis. If your workflow involves code, data exploration, and repeated chart refinement, it gives you more room to iterate than a simple text-to-chart tool.
ChartGPT remains a useful open-source project. If you want a more notebook-native workflow around analysis and charting, RunCell (opens in a new tab) is the more relevant tool to evaluate next.
Happy charting!
FAQ
Can GPT-4 create charts?
While GPT-4 is a highly advanced text-based model, it doesn't inherently create visual charts. However, tools like ChartGPT have been developed to harness the power of GPT-4, making it possible to transform textual descriptions into visual charts.
Is there AI that can create charts and graphs?
Yes, there are several AI tools that can generate charts and graphs from text or data. ChartGPT is useful for text-to-chart generation, while RunCell (opens in a new tab) is better suited to notebook-based workflows where you also need code execution, analysis, and iterative chart refinement.
How to use Chart GPT? You can follow the README file of the ChartGPT GitHub repo, or use RunCell (opens in a new tab) if you want a Jupyter-native agent that can build charts while also handling the underlying analysis.