Matplotlib Colormaps: Interactive Explorer and Complete Gallery


A colormap (cmap) is the lookup table Matplotlib uses to turn numbers into colors. Any plotting call that takes a c= or a 2D array also takes cmap=, and you set it by name:
import matplotlib.pyplot as plt

plt.imshow(data, cmap="viridis")   # heatmaps, images, 2D arrays
plt.scatter(x, y, c=values, cmap="plasma")   # color encodes a third variable
plt.colorbar()   # always add this so the colors are readable
Append _r to reverse any colormap (viridis_r, Blues_r). If you only need one rule: use viridis for ordered data, RdBu when zero matters, and tab10 for categories.
The explorer below renders every colormap that ships with Matplotlib, grouped the way the official docs group them. Click a color bar to copy its cmap= argument.
Interactive reference
Matplotlib Colormap Explorer
Every colormap that ships with Matplotlib, grouped the way the official docs group them. Click a color bar to copy the cmap argument, or use the second button for a colormap object.
Perceptually Uniform Sequential
Lightness increases monotonically, so equal steps in data look like equal steps in color. Safe default for heatmaps and any continuous value.
- viridisCB-safe
- plasmaCB-safe
- infernoCB-safe
- magmaCB-safe
- cividisCB-safe
Sequential
Single-hue or two-hue ramps from light to dark. Use for data that goes from low to high with no meaningful midpoint.
- GreysCB-safe
- PurplesCB-safe
- BluesCB-safe
- GreensCB-safe
- OrangesCB-safe
- RedsCB-safe
- YlOrBrCB-safe
- YlOrRdCB-safe
- OrRdCB-safe
- PuRdCB-safe
- RdPuCB-safe
- BuPuCB-safe
- GnBuCB-safe
- PuBuCB-safe
- YlGnBuCB-safe
- PuBuGnCB-safe
- BuGnCB-safe
- YlGnCB-safe
Sequential (2)
Older sequential ramps kept for compatibility. Lightness is not always uniform, so check them before using for quantitative encoding.
- binaryCB-safe
- gist_yarg
- gist_gray
- grayCB-safe
- boneCB-safe
- pink
- spring
- summer
- autumn
- winter
- cool
- Wistia
- hot
- afmhot
- gist_heat
- copperCB-safe
Diverging
Two ramps meeting at a light or dark midpoint. Use when zero, a mean, or another reference value is meaningful — always center the norm on it.
- PiYGCB-safe
- PRGnCB-safe
- BrBGCB-safe
- PuOrCB-safe
- RdGy
- RdBuCB-safe
- RdYlBuCB-safe
- RdYlGn
- Spectral
- coolwarmCB-safe
- bwrcaution
Pure red/blue is hard for red-green colorblind readers. Prefer RdBu or coolwarm.
- seismiccaution
Very saturated; check contrast before publishing.
- berlinCB-safe3.10+
- managuaCB-safe3.10+
- vanimoCB-safe3.10+
Cyclic
Start and end colors match, so the map wraps. Use for angles, phase, wind direction, or time of day.
- twilightCB-safe
- twilight_shiftedCB-safe
- hsvcaution
Constant lightness — differences are invisible in grayscale print.
Qualitative
Unordered sets of distinct colors for categories. Do not use them to encode magnitude.
- Pastel1
- Pastel2
- PairedCB-safe
- Accent
- Dark2CB-safe
- Set1
- Set2CB-safe
- Set3
- tab10CB-safe
- tab20
- tab20b
- tab20c
- okabe_itoCB-safe3.11+
Miscellaneous
Special-purpose and legacy colormaps. Several (jet, rainbow, gist_ncar) have uneven lightness and create false structure in data.
- flagcaution
Repeating stripes. Decorative only.
- prismcaution
Repeating stripes. Decorative only.
- ocean
- gist_earth
- terrain
- gist_stern
- gnuplot
- gnuplot2
- CMRmap
- cubehelixCB-safe
- brgcaution
Dark at both ends; the midpoint reads as an extreme.
- gist_rainbowcaution
Not perceptually uniform; avoid for quantitative encoding.
- rainbowcaution
Not perceptually uniform; invents structure that is not in the data.
- jetcaution
Uneven lightness creates false bands. Use viridis or turbo instead.
- turbo
- nipy_spectralcaution
Non-uniform lightness; readable only with a colorbar.
- gist_ncarcaution
Highly non-uniform lightness. Decorative use only.
Sampled from Matplotlib 3.11.1 at 32 points per continuous colormap; qualitative colormaps show their exact color list. Every name also has a reversed twin — append _r (for example viridis_r) or use the toggle above.
- How to Use DeepSeek Harness: Install, Set Up, and Run Your First Agent
- Runcell Science: An Open Source Alternative to Claude Science for Research Workflows
- How to Make Mac Not Sleep: Keep Codex, Claude Code, and AI Agents Running
- OpenClaw vs ZeroClaw vs Pi Agent vs Nanobot: Which AI Agent Stack Should You Choose in 2026?
- Can Claude Code Analyze Jupyter Notebooks for Data Science? What It Actually Does
- Claude Code Routines: Why AI Agent Cron Jobs Matter
- Claude Code Desktop Bypass Permissions: How to Enable It
- How to Build Two Python Agents with Google’s A2A Protocol - Step by Step Tutorial
- Top 10 growing data visualization libraries in Python in 2025
Which family should you use?
Pick the family from the shape of your data, then pick a name inside it for taste.
| Your data | Family | Safe defaults | Why |
|---|---|---|---|
| Ordered, low to high (counts, density, magnitude) | Sequential | viridis, magma, Blues | Lightness rises with value, so the eye reads the ranking correctly |
| Centered on a reference (change, residuals, correlation) | Diverging | RdBu, coolwarm, BrBG | Two ramps meet at a neutral midpoint you can pin to zero |
| Unordered categories (labels, classes, groups) | Qualitative | tab10, Set2, Dark2 | Distinct hues with no implied ranking |
| Angles, phase, time of day, wind direction | Cyclic | twilight, hsv | The first and last colors match, so the map wraps |
| Terrain, decorative fills | Miscellaneous | terrain, cubehelix | Special purpose; check lightness before using quantitatively |
Two rules cover most mistakes:
- Never use a qualitative map for continuous data.
tab10on a heatmap creates bands that are not in the data. - Never use a diverging map without centering the norm.
plt.imshow(data, cmap="RdBu")on data from 3 to 90 puts the white midpoint at 46.5, which reads as "neutral" even though nothing is neutral there. UseTwoSlopeNorm(vcenter=0)instead.
from matplotlib.colors import TwoSlopeNorm

norm = TwoSlopeNorm(vmin=data.min(), vcenter=0, vmax=data.max())
plt.imshow(data, cmap="RdBu_r", norm=norm)
plt.colorbar()
Accessibility: what "CB-safe" means in the explorer
Roughly 1 in 12 men and 1 in 200 women have some form of color vision deficiency, most commonly red-green. The badge in the explorer marks colormaps that stay readable under the common forms, because they vary in lightness and not only in hue.
Practical guidance:
- Prefer the perceptually uniform maps (
viridis,magma,inferno,plasma,cividis).cividisis specifically designed to look near-identical to readers with and without deuteranomaly. - For diverging data, prefer
RdBu,BrBG, orPuOroverbwr— pure red against pure blue is the exact pairing that collapses for red-green deficiency. - For categories,
tab10andDark2hold up better thanSet1. Matplotlib 3.11 also shipsokabe_ito, the reference colorblind-safe categorical set. - Whatever you choose, test it in grayscale. If the figure survives being printed in black and white, it survives most color vision deficiencies too.
Why you should stop using jet
jet and rainbow are still the fastest way to make a misleading figure. Their lightness is not monotonic: it peaks in the cyan and yellow bands and drops at both ends. The eye reads those bright bands as edges, so the colormap invents boundaries that do not exist in the data. The same figure rendered in viridis shows a smooth gradient.
If you inherited code that uses jet, viridis is a drop-in replacement for scientific data, and turbo is the drop-in replacement when you specifically want a rainbow-like high-contrast map without the false banding.
Setting a colormap once for the whole script
Rather than repeating cmap= in every call, set the default:
import matplotlib.pyplot as plt

plt.rcParams["image.cmap"] = "viridis"   # applies to imshow, pcolormesh, contourf
For the categorical color cycle used by plot() and bar(), set the property cycle instead:
from cycler import cycler

colors = plt.get_cmap("tab10").colors
plt.rcParams["axes.prop_cycle"] = cycler(color=colors)
See Matplotlib style sheets for packaging these defaults into a reusable style.
Five patterns you will actually use
All examples assume:
import numpy as np
import matplotlib.pyplot as plt
1. Continuous colormap with imshow
The most basic use of colormaps is to visualize 2D arrays with imshow — heatmaps, images, or any regular grid.

import numpy as np
import matplotlib.pyplot as plt

data = np.random.randn(50, 50).cumsum(axis=0)

plt.figure()
plt.imshow(data, cmap="viridis")
plt.colorbar()
plt.title("Continuous colormap with imshow (viridis)")
plt.tight_layout()
plt.show()
You get a smooth heatmap using the perceptually uniform viridis colormap. plt.colorbar() draws the color scale, without which the reader cannot map color back to value.
2. Scatter plot with a colormap and colorbar
Colormaps let you encode an extra numeric dimension in a scatter plot — time, intensity, probability.

import numpy as np
import matplotlib.pyplot as plt

np.random.seed(0)
x = np.linspace(0, 10, 200)
y = np.sin(x) + 0.1 * np.random.randn(200)
values = np.linspace(0, 1, 200)

plt.figure()
scatter = plt.scatter(x, y, c=values, cmap="plasma")
plt.colorbar(scatter, label="value")
plt.title("Scatter with colormap (plasma)")
plt.tight_layout()
plt.show()
c=values supplies the numbers to map; pass the returned scatter object to plt.colorbar() so the bar matches the points. More scatter options: Matplotlib scatter plot.
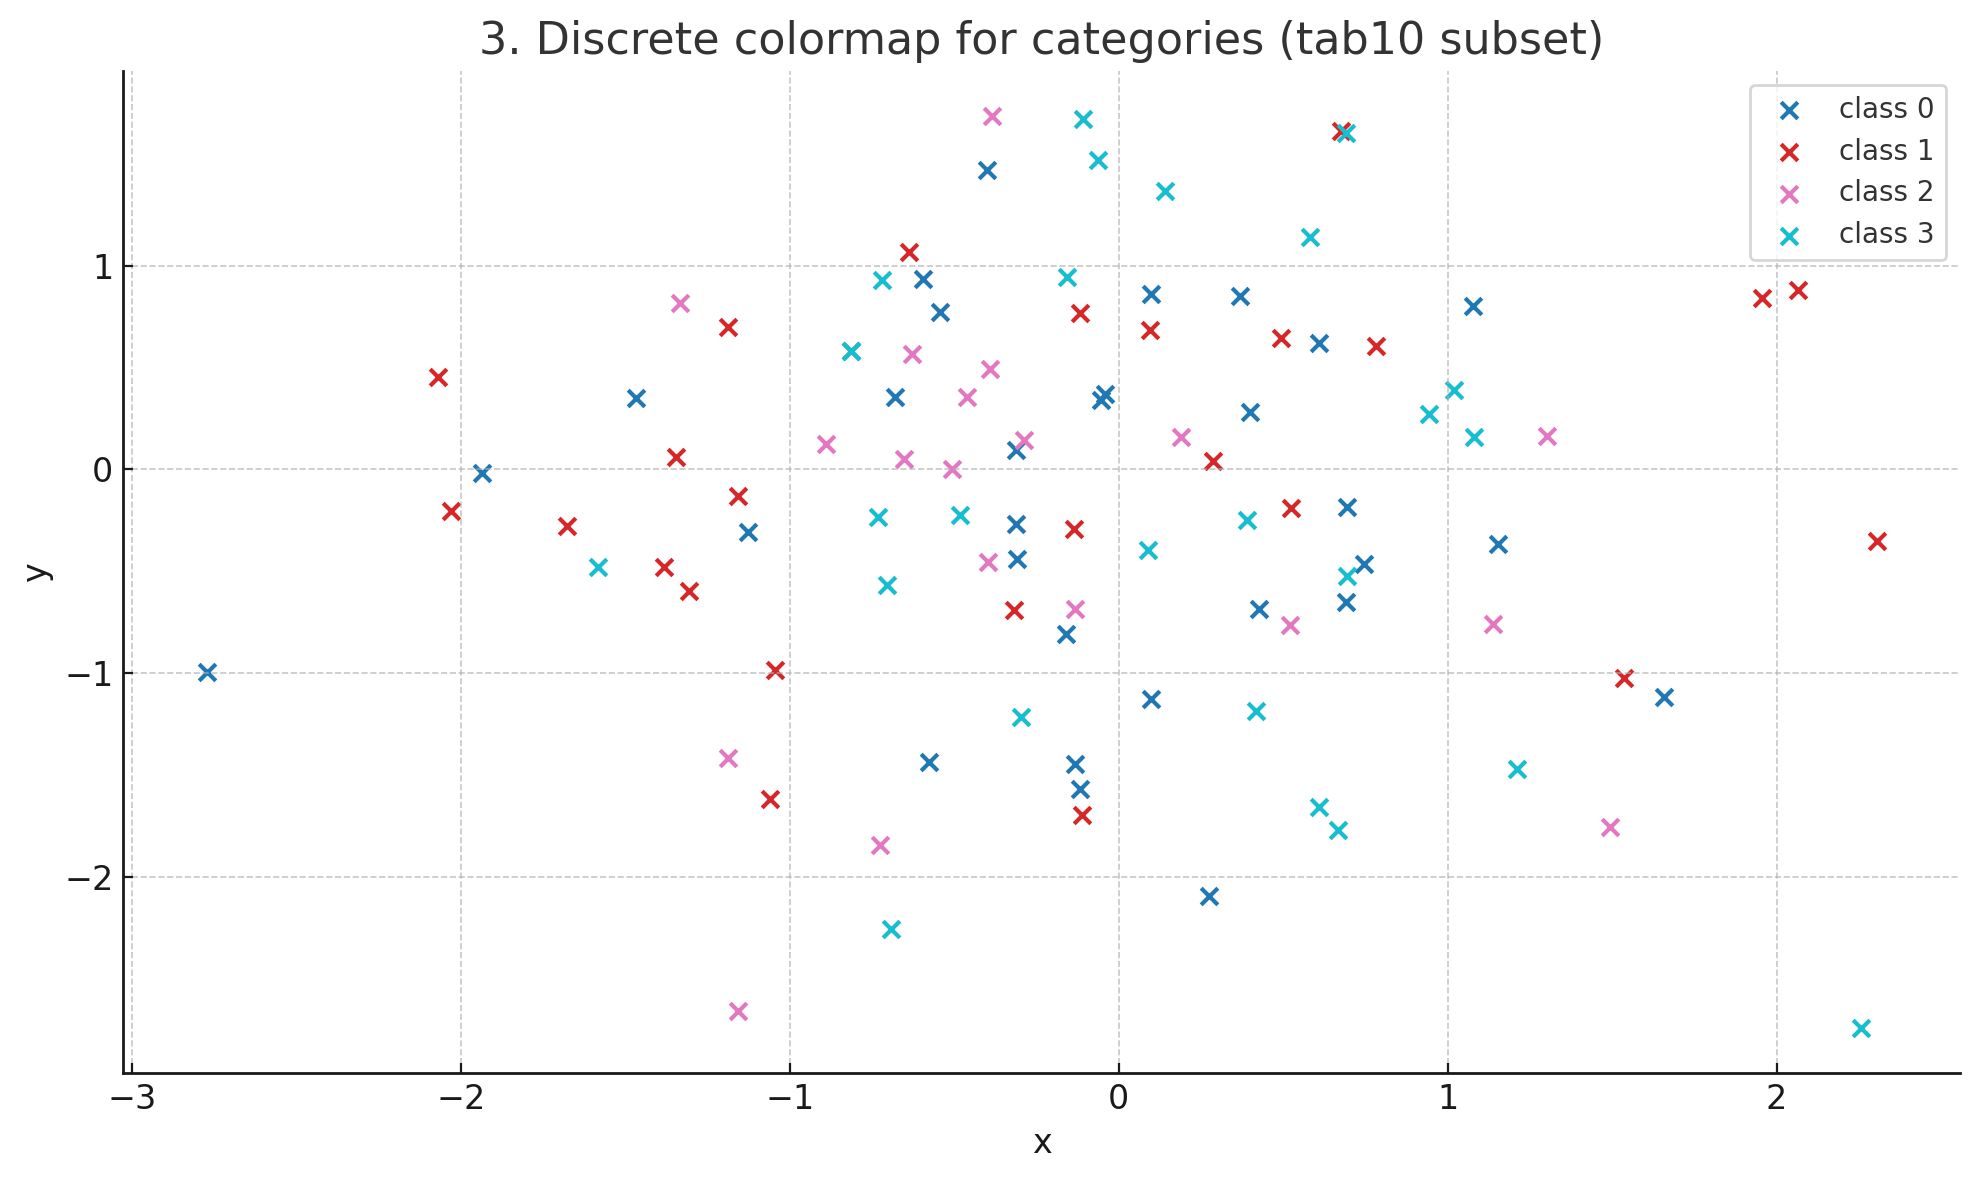
3. Discrete colors for categories
Colormaps are continuous by default, but you can slice a small set of stable colors for classification results or labels.

import numpy as np
import matplotlib.pyplot as plt
from matplotlib.colors import ListedColormap

categories = np.random.randint(0, 4, 100)
x = np.random.randn(100)
y = np.random.randn(100)

base_cmap = plt.get_cmap("tab10")
cmap_disc = ListedColormap(base_cmap(np.linspace(0, 1, 4)))

plt.figure()
for i in range(4):
    mask = categories == i
    plt.scatter(x[mask], y[mask], c=[cmap_disc(i)], label=f"class {i}")

plt.legend()
plt.title("Discrete colormap for categories (tab10 subset)")
plt.tight_layout()
plt.show()
ListedColormap builds a colormap from an explicit list of colors — the right tool when you need a small number of stable category colors. For placing the resulting key, see Matplotlib legend.
4. Nonlinear scaling with LogNorm
When data spans several orders of magnitude, a linear mapping hides structure. Combine the colormap with a normalization.
import numpy as np
import matplotlib.pyplot as plt
from matplotlib.colors import LogNorm

x = np.linspace(0.01, 2, 200)
y = np.linspace(0.01, 2, 200)
X, Y = np.meshgrid(x, y)
Z = np.exp(X * Y)

plt.figure()
pcm = plt.pcolormesh(X, Y, Z, norm=LogNorm(), cmap="magma")
plt.colorbar(pcm, label="exp(x * y)")
plt.tight_layout()
plt.show()
The norm controls how values map into [0, 1] before the colormap is applied. Other useful norms: Normalize, BoundaryNorm (for binned ranges), PowerNorm, and TwoSlopeNorm.
5. Sampling colors from a colormap
Colormaps are callable. cmap(t) returns an RGBA color for t in [0, 1], which is how you give a set of lines a coherent color progression.

import numpy as np
import matplotlib.pyplot as plt

cmap = plt.get_cmap("cividis")
xs = np.linspace(0, 10, 200)

plt.figure()
for i, freq in enumerate(np.linspace(0.5, 2.5, 6)):
    plt.plot(xs, np.sin(freq * xs), label=f"freq={freq:.1f}", color=cmap(i / 5.0))

plt.legend(title="frequency")
plt.tight_layout()
plt.show()
Note that plt.cm.<name> still works but plt.get_cmap("name") is the form that keeps working across Matplotlib 3.7+ deprecations of the matplotlib.cm registry helpers.
Common errors
| Symptom | Cause | Fix |
|---|---|---|
ValueError: 'Viridis' is not a valid value for cmap | Names are case sensitive | Use viridis; ColorBrewer names keep their capitals (RdBu, YlGnBu) |
Same ValueError for berlin or okabe_ito | Colormap added in a newer release | berlin, managua, vanimo need Matplotlib 3.10+; okabe_ito needs 3.11+ |
AttributeError: module 'matplotlib.cm' has no attribute 'get_cmap' | Removed in Matplotlib 3.9 | Use plt.get_cmap(name) or matplotlib.colormaps[name] |
| Colors look flipped | Ramp direction | Append _r, e.g. cmap="RdBu_r" |
| Colorbar range ignores outliers | Default norm uses data min/max | Pass vmin=/vmax= or a Normalize instance |
Related Guides
- Matplotlib Colormap: Complete Guide — the concept guide, including building custom colormaps and tuning colorbars.
- Seaborn Color Palettes — the Seaborn side of the same problem, with
deep,rocket,vlag, and an interactive palette explorer. - Seaborn Heatmap — where colormap choice matters most in practice.
- Matplotlib Style Sheets — lock your colormap and color cycle into a reusable style.
- Matplotlib Scatter Plot — the plot type that most often carries a colormap as a third dimension.
- Matplotlib Plot Image —
imshowdetails, interpolation, and aspect handling.